Behavioral insights for traffic safety
This case study illustrates how behavioral insights can help to increase traffic safety and prevent road deaths. It builds on a real-world challenge, while the solution and the underlying data are illustrative examples only. [1]
Behavioral root causes: Why do road accidents happen?
Road traffic injury is one the leading causes of death worldwide. A key reason why road accidents occur is speeding: many fatal crashes could be prevented if people just complied with speed limits.
Once car drivers are in a rush to get home quickly, are upset from work, or just enjoy a thrilling ride, speed limits and even sanctions seem to be less important. Drivers are in a mental state in which they underestimate the risks of their own behaviors, an effect called the “hot-cold empathy gap”. They do not fully grasp how much their current priorities are influenced by their “hot state” and value arriving 5 minutes earlier much higher than they would normally do. How can we empower drivers to better judge pertaining risks and persuade them to voluntarily slow down?
Behavioral design: What are the most promising nudges to increase speed limit compliance?
In this case study, we present three options as possible solutions to counter the hot-cold empathy gap and encourage drivers to abstain from speeding:
1. Option: Shock nudge
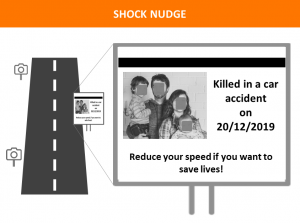
Some authorities have started to install warning signs next to highways. Saliently placed to attract the drivers’ attention, they use emotionally loaded prompts to kick back drivers to their “cold” states. A widely used approach, for example, is stylized death announcements. They use personas to mobilize empathy between the drivers and potential victims. The warning signs intend to shock drivers and re-activate their cold state so that drivers better recognize the risks of their actions.
2. Option: Optical nudge
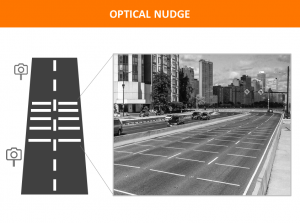
Other entities have started to experiment with nudges using optical illusions. A prominent example is to paint horizontal lines on highways asphalts which get progressively narrower. These lines amplify the feeling of speeding among drivers and create a moment of surprise in the driver’s routine. Drivers perceive the situation as if they are accelerating and intuitively respond by slowing down.[2]
3. Option: Noise nudge
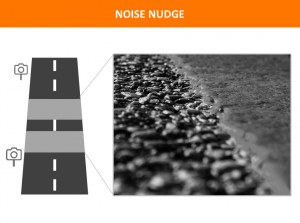
Have you ever driven an old, worn out car on the highway? Then you will probably have experienced some discomfort whenever you passed over coarse asphalt coatings. The same effect can be replicated on purpose by using a noise nudge. Different coating strips on the asphalt can considerably increase the interior noise levels at a certain speed without depreciating vehicle components. As people dislike noise, they are nudged to slow down to feel more comfortable.
Behavioral pilot: What works best?
To learn which option works best, assume that the three nudges compete in a pilot intervention under real-world conditions. Highway sections with comparable average traffic volume, speed and accident rates would be selected to serve as natural field environments. The sections would be assigned to the shock, optical, or noise nudge. A fourth highway section would serve as benchmark. In this section, drivers would not be nudged to slow down.
Covert speed cameras would be placed along the highways. The cameras would measure car speed at several points over a distance of five kilometers to assess the differences before and after a nudge. Once the pilot intervention is completed, driving behavior under the four conditions can be analyzed.
Evaluation: Which nudge offers the highest social return-on-investment?
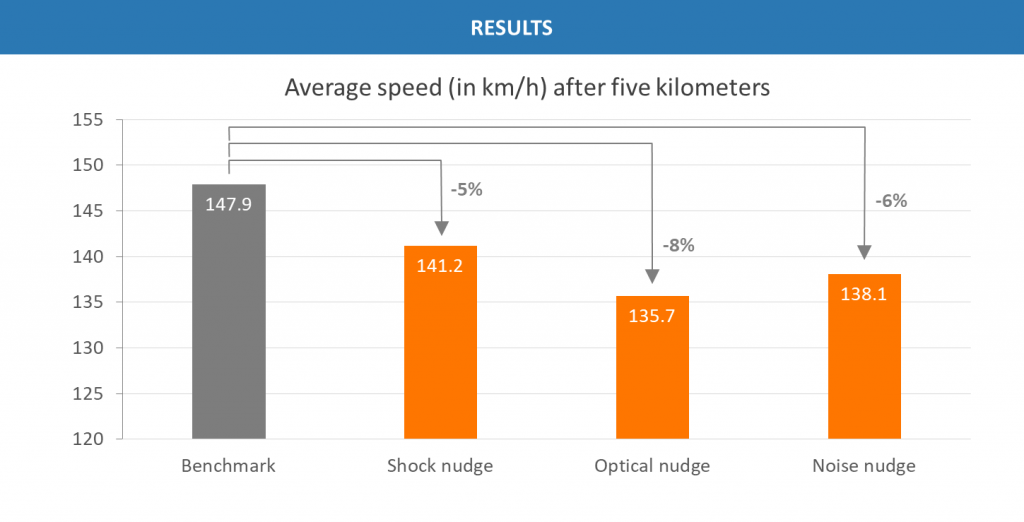
According to the exemplary data, all three nudges would be quite successful in lowering average speed on highways in comparison to benchmark behavior. The shock nudge would reduce the average speed by 5%, the noise nudge by 6% and the optical nudge by 8%.
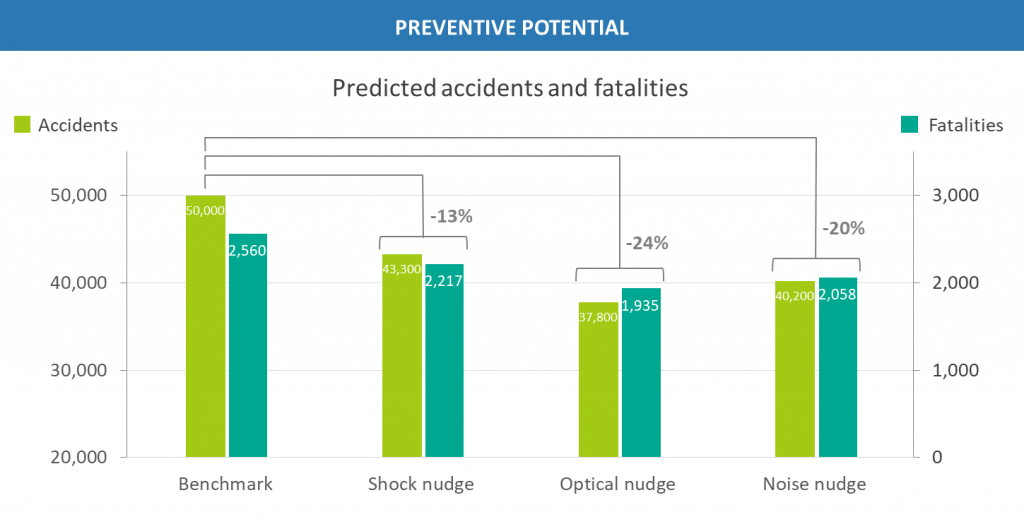
The pilot results could now help to assess the preventive potential of each nudge. Linking the speed data to traffic and accident statistics, the next figure shows what policy makers can expect from a large-scale implementation. It shows predictions for prevented accidents and fatalities for the 100 most lethal highway sections in the EU.[3]
Accidents and fatalities would decrease by 13% if shocking warning signs are installed across all deadly highway sections; installing the noise nudge would lead to a reduction of 20% and rolling out the optical illusion nudge would lower accidents and fatalities by 24% compared to the benchmark. Does this mean policy makers should invest the available budget in rolling out the optical nudge?
We don’t know yet. To provide a final answer to this question, the costs for production, installation and maintenance need to be taken into account. Only if the costs are considered, the nudges’ social returns become visible and their effectiveness can be compared on a solid like-for-like basis.
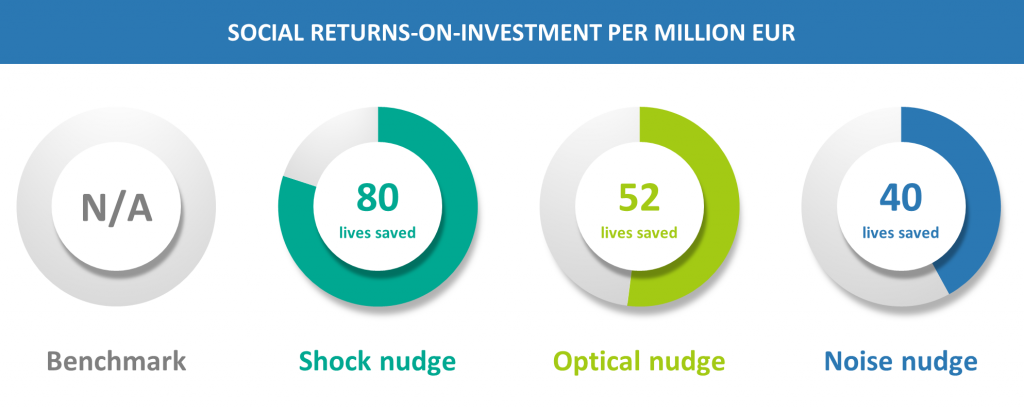
With estimated costs of EUR 43,000 for each shock nudge, EUR 120,000 for each optical nudge and EUR 125,000 for each noise nudge, the next figure reveals the anticipated social returns-of-investment for every million EUR spent on improving traffic safety.
The circles show that for every million EUR spent on shock nudges, 80 lives would be saved. Investing the same amount to install optical nudges would “only” save 52 lives. Implementing the noise nudge, as the third option, would result in 40 lives saved.
Comparing the social returns shows that the initial evaluation of the nudging effects was misleading: if only a limited budget is available, the data would suggest to implement the shock nudge in order to optimally increase traffic safety.
Key takeaway
Better driving behavior can be stimulated by various triggers. Without prior testing, however, we will not learn whether an intervention really works.
Sound pilots do not only provide evidence on what works. They also inform decision-makers about the anticipated social returns and help them prioritize the available options before they make a final decision on which solution to implement.
If you are interested in behavioral insights to improve public or private safety, please get in touch with us. We are always excited to learn more and help if we can.
[1] Behavia makes no warranty, representation or undertaking whether expressed or implied, nor does it assume any legal liability, whether direct or indirect, or responsibility for the accuracy, completeness, or usefulness of any information presented in the case study.
[2] Source: https://www.caranddriver.com/features/a25378462/road-design-for-safer-driving/ (last accesses 10/01/2020).
[3] The predictions are made for European highways assuming that the 100 most lethal highway sections in the EU account for around 2,560 road deaths and 50,000 accidents per year and that a 1 km/h decrease in car speed leads to a 2 percent reduction in accidents (WHO 2004, European Commission 2018).
